Planning the Project Schedule
Published: 2009-02-03
Last updated: 2022-03-20
Following the project planning process, we continue with planning the project schedule, sometimes called project scheduling, in 3 steps.
So far, we know
- the product and its parts we have to create with our project
- all the necessary work for that, in form of work packages
- and effort and duration of each work package
The three steps of project scheduling are the milestone plan, the network diagram and the Gantt chart.
Step 4 – Milestone Plan
We plan major project milestones, the special and most important points of our project time line. In project implementation phase, the project milestone plan will enable us to control the progress on the highest level of schedule.
Step 5 – Network Diagram
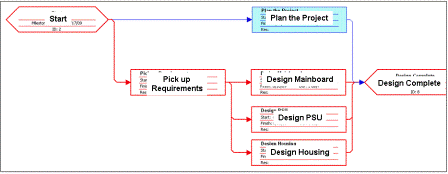
In the next step, we establish a network diagram of all the work packages of our WBS. We essentially ask the question, which work package has to be finished before another one can be started. The network diagram gives a graphical overview over the logical sequence of all the work packages that have to be done and the milestones that have to be accomplished. It will enable us to control project implementation progress on the level of logical work sequence.
Step 6 – Gantt Chart
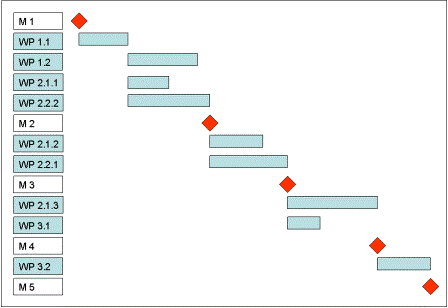
To conclude project scheduling we draw a graphic with all the work packages as bars, each one located with reference to a common time line, and with each one’s length corresponding to its duration. The Gant chart (or bar chart) gives a graphical overview over the schedule of all the work packages that have to be done and the milestones that have to be accomplished. This will enable us to control project progress work package by work package referring to real time.
Network diagram and Gantt chart are equivalent in the sense that the first one is a mathematical representation (logical sequence) and the second one a physical representation (reference to real time) of the project schedule. In both representations, we usually find several logical paths in parallel, from the beginning of the first work package (project start) to the end of the last work package (project end) of the whole diagram or chart. Now we can add up all the durations along each of those paths. The path with the longest total duration, from project start to project end, we call the critical path of the project. Hence, we call this planning method critical path method or CPM. For more details on CPM, please refer to Critical Path.
Optimization of the project schedule
Given the pre-condition that the work breakdown structure (WBS) is complete, free of contradictions, and has work packages on its lowest level (cf. sub-section about planning the project scope), our first priority will be that our project schedule represents a sequence of work packages that follows a natural work logic. So, we sit down with our team, set the major milestones for our project, and arrange all the work packages of the WBS into a logical sequence based on our understanding of a natural work flow.
Let us pick up the example of the sub-section on project scope, take the function oriented WBS, and develop the first draft of a milestone plan and network diagram, with a result similar to the following diagram.
We notice that we do not yet need the results of effort estimation in order to set up the first draft of a milestone plan and network diagram.
In order to set up the Gantt chart we need the durations of the work packages. Our example might look as follows.
After filling in durations for all the work packages we obtain the first draft of a project schedule, usually presented as Gantt chart, like in our example.
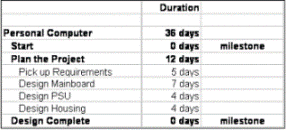
Using project planning software, gives us the opportunity to show different aspects of that project schedule, especially the Gantt chart. One aspect is the critical path. The critical path is that sequence of work packages with the longest total duration, from project start to project end. Here is our example of which we show a small part.
Continuing with project schedule optimization, the second criterion is overall project duration, i.e. total duration of the critical path. Analysis of the critical path and its work packages eventually results in a change of the logical sequence: setting originally sequential work packages in parallel. We can do that either by just putting them in parallel if the natural work logic and availability of resources allow it; or by changing the type of logical dependency between work packages. There are four types of dependency:
- End-to-Start: WP B cannot be started until WP A is finished.
- End-to-End: WP B cannot be finished until WP A is finished.
- Start-to-Start: WP B cannot be started until WP A is started.
- Start-to-End: WP B cannot be finished until WP A is started.
Usually, we set the first draft of a network diagram with sequential work packages of type 1 dependency, End-to-Start. After checking carefully, for some of those dependencies we can choose type 2 or 3, and so, partially put them in parallel.
In our example, we could start WP "Design Main board" virtually at the same time as WP "Pick up Requirements", by applying generally accepted requirements, and doing a revision of the design after the requirements of users are known. This would change the dependency of those two work packages "Pick up Requirements" and "Design Main board" to type (2). The following picture illustrates that.
This example shows also that the critical path can change (as WP "Design Main board" is no longer on the critical path) after changing dependency types.
Summary
Planning the
project schedule is a recursive task: we set up a first draft of
milestone plan, network diagram, and Gantt chart. Then, we go through
steps 4, 5, and 6 several times in order to optimize these results by
following two main criteria:
- the sequence of work packages follows a natural work logic;
- minimum overall project duration.
Thus, we obtain an optimized schedule in terms of logical sequence and project duration. Compare also this case study on finding the project duration.
35+ templates, tools, and checklists in one set
To save you time in your daily work as a project manager, I packaged more than 35 project management templates, tools, and checklists into one zip file.
- You un-zip it, and you get all items in formats you can edit to your requirements.
- They strictly contain only standard functionality and no macros or other code.
- You are allowed to use your logo.
or click here for more info.
Traditional PM
Learning Path Navigation
|
|
|
Return to Project Planning
Return from Planning the Project Schedule to Home Page
|
|
|


Your Comments
Have your say about what you just read! Leave me a comment in the box below.