Critical Path of a Project
Published: 2009-10-19
Last updated: 2022-03-16
What is the critical path of a project?
There are several definitions and different ways of calculating it available. We introduce a simple one here.
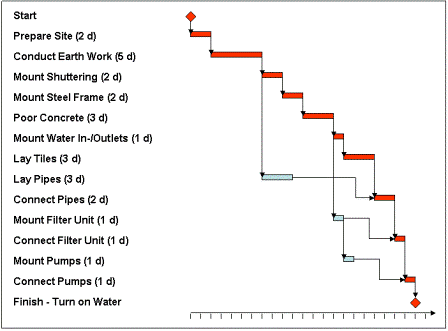
We assume that we have network diagram and Gantt chart of a project, including all data resulting from effort estimation, similar as in the following picture of a simple Gantt chart, representing the implementation phase of the construction of a swimming pool.
The critical path of a project is the path with the longest total duration, from start to finish.
In our example, the Gantt chart shows the work packages, their durations (in days), and the critical path (in red). Work packages "Lay Pipes", "Mount Filter Unit", and "Mount Pumps" have a free float of 8 days, 5 days, and 5 days, respectively.
From effort estimation,
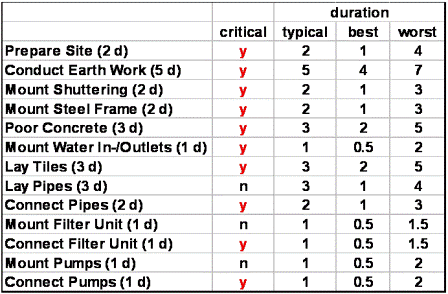
we might also know best case and worst case durations of all the work
packages. We summarize these additional data in the following table.
Critical Path Analysis
Now, we continue with critical path analysis. The most important question is: Since we have best and worst case estimates of the duration of each work package, what consequences does this have for the overall project duration? During implementation, we expect some work packages going typical, others better than typical, and maybe others worse than typical.
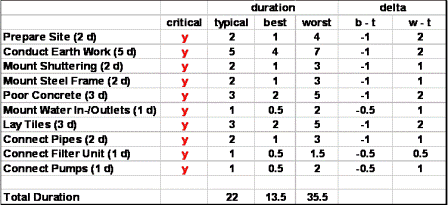
In a first step, we only focus on work packages that are on the critical path, and calculate the differences between best and typical (b – t), and between worst and typical (w – t) durations. Our example would look like this:
That table shows the deltas in columns "b – t" and "w – t". It also shows the total duration if everything unfolds typically (22 days), in its best way (13.5 days), and in its worst way (35.5 days). So, we know the 100%-interval for the total duration of our project implementation of construction of a swimming pool: it will take us minimum 13.5 days, maximum 35.5 days.
This estimate seems to be quite rough, and indeed, it is. We might require a good estimate of a smaller interval, maybe, not on a 100%-level, but an interval on a confidence level that is high enough under most conditions.
A little bit of mathematical statistics can help. In the second step, we will use a concept that is analogous to the concept of standard deviation SD. Mathematical statistics says that in 95% of all cases the total duration will be in the interval of the typical duration plus or minus 2 standard deviations:
Total duration within t – 2•SD and t + 2•SD
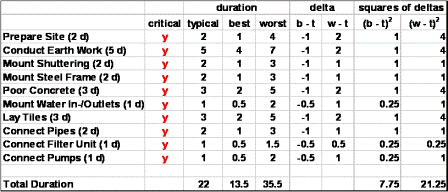
Unfortunately, we cannot calculate the standard deviation as it is done in mathematical statistics. Let us improvise a little. In order to obtain the lower bound of the 95%-interval, we calculate the sum of all squares of b – t. Similarly, in order to obtain the upper bound of the 95%-interval, we calculate the sum of all squares of w – t. The last two columns of the following table show what we get.
Finally, we square root these two values into
SD_best = sqrt(7.75) = 2.8
SD_worst = sqrt(21.25) = 4.6
and we obtain lower bound and upper bound of the 95%interval of our total duration
Lower = t – 2•SD_best = 22 – 5.6 = 16.4 days
Upper = t + 2•SD_worst = 22 + 9.2 = 31.2 days
This means that the total duration of implementation of our example will be minimum 16.4 days, and maximum 31.2 days, with 95% probability. It seems to be still a little rough. If you live with a probability of 68 % then you would have an interval from 19.2 days to 26.6 days (i.e. with a probability of 68%, the duration of implementation will be between 19.2 and 26.6 days).
In section Free Downloads, we offer a template for critical path analysis that follows the description above, and contains the same example. Download it and play with it to get used to that concept.
35+ templates, tools, and checklists in one set
To save you time in your daily work as a project manager, I packaged more than 35 project management templates, tools, and checklists into one zip file.
- You un-zip it, and you get all items in formats you can edit to your requirements.
- They strictly contain only standard functionality and no macros or other code.
- You are allowed to use your logo.
or click here for more info.
Traditional PM
Learning Path Navigation
|
|
|
Return to Project Planning
Return from Critical Path to Home Page
|
|
|


Your Comments
Have your say about what you just read! Leave me a comment in the box below.