- Home
- Planning Continued
- Project Controlling Tools
Project Controlling Tools
Published: 2009-03-30
Last updated: 2022-03-20
In this sub-section, we present a more detailed description of project controlling tools that we will use during implementation phase as items of our project management dashboard. Additionally, the tools must also yield all the information we need to report into any management system for multiple projects, like a project portfolio dashboard.
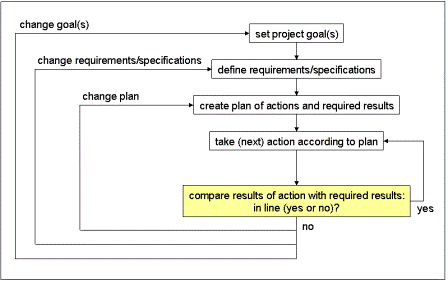
In implementation phase, we will follow the project plans in terms of what actions we take and what results we expect. Then, our controlling tools of choice must support the comparison between planned and real life actions, as well as between expected and actual results. The following diagram highlights this comparison:
As a general guideline, we can conclude that each individual controlling tool must fit to the type of work and the way we work in our project.
There are two types of tools or project management metrics for measuring / controlling the work progress of individual work packages or of a whole sub-project or project. Our presentation includes milestone trend analysis and earned value analysis (earned value management) using indices such as cost performance index, schedule performance index, cost variance, and schedule variance.
Controlling Tools for Individual Work Packages
(1) Measuring Quantities
We measure the
progress of a work package in terms of completed parts of the same kind,
for example: completed ground area of a building (in sqm), laid cable
(in m), number of doors, windows, etc. installed, number of sockets
manufactured (in pieces), etc.
(2) 0 – 50% - 100% Method
In case a work package has a result that we cannot express in terms of equal parts we indicate the work progress by
- 0% for “not yet started”,
- 50% for “started, but not yet completed”,
- 100% for “completed”.
This works for most medium size research & development, or engineering & design work packages. The 0 – 100% method is similar, but for very small work packages.
(3) Estimation of the Necessary Remaining Effort and Duration
For
large research & development, or engineering & design work
packages, the 0 – 50% - 100% method would be too inaccurate. In this
case, we usually would ask the work package expert for the rate of
completion. Additionally, we recommend asking for the portion of work
that still has to be accomplished, in terms of estimated necessary
remaining effort and duration.
Controlling Tools for the Whole Project
(4) The "Simple" Tools
We have a work breakdown
structure (WBS), network diagram and Gantt chart, and an accumulated
cost plan of our project. So, why not use them as project controlling
tools?
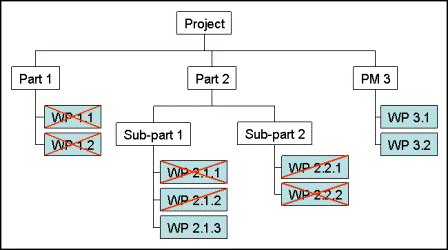
Let's start with the WBS. Twelve weeks into a project and applying the 0%-50%-100% method, we obtain a diagram like this:
Work packages 1.1, 1.2, 2.1.1 and 2.2.2 are complete, 2.1.2 and 2.2.1 started but not yet complete, and 2.1.3, 3.1 and 3.2 not yet started.
The same 0%-50%-100% method together with the network diagram yields information about the status of the work progress regarding the logical sequence of work packages:
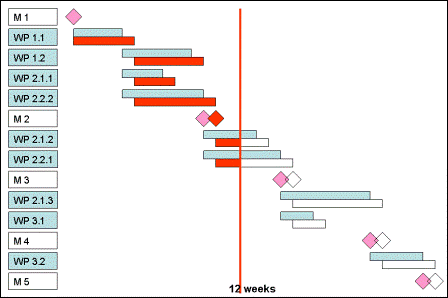
If we want to know our project status in terms of schedule we use the Gantt chart. A blue bar for each work package indicates its planned time and a red bar below it its actual time.
For example, work package 1.1 was started on time, but it took one week longer to complete it; work package 1.2 was started one week later and finished one week later, etc. So, as of twelve weeks into our project, it seems to be one week behind schedule.
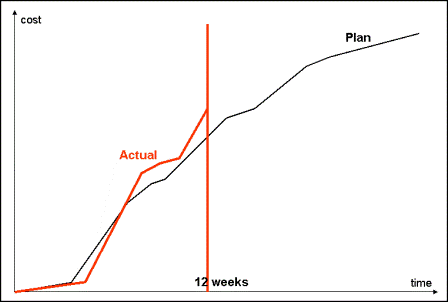
The following diagram combines planned cost and actual cost, showing that our project is over budget.
(5) Milestone Trend Analysis (MTA)
MTA
represents the most popular project controlling tool. It requires a
milestone plan on project level. In general, many work packages lead up
to one of the milestones. However, we only focus on the milestone level.
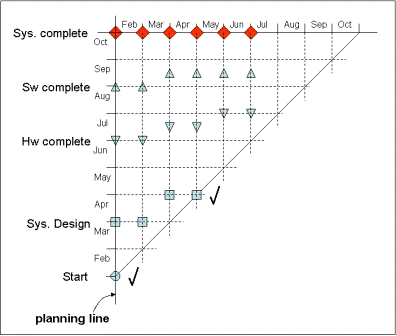
The following picture shows the MTA chart at the end of planning phase,
presenting the planned milestones.
In sub-section Milestone Trend Analysis, you find a more detailed explanation how MTA works; in sub-section Free Downloads, you find an interactive animation of MTA, under demos.
(6) Earned Value Analysis (EVA) or Earned Value Management
As another widely used project controlling tool, Earned Value Analysis helps to control cost and schedule in larger projects or sub-projects.
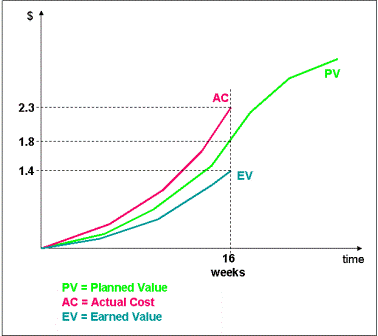
The following picture shows a snapshot of EVA in a small project.
We use the values
- Planned Value PV
- Earned Value EV
- Actual Cost AC
to calculate Cost Performance Index (CPI) and Schedule Performance Index (SPI) with the following formulas:
In our example, we obtain CPI = 0.609 and SPI = 0.778 indicating that
we are over budget and behind schedule.Earlier presentations refer to
- Cost Variance CV = BCWP – ACWP = EV - AC
- Schedule Variance SV = BCWP – BCWS = EV – PV
The
two project controlling tools, milestone trend analysis (MTA) and
earned value analysis (EVA), summarize the work progress on project
level. In case more detailed information is needed we turn to those
tools that measure the work progress of individual work packages.
In our sub-section Free Downloads you find templates which you can use for your specific project. Feel free to adapt them to your needs.
35+ templates, tools, and checklists in one set
To save you time in your daily work as a project manager, I packaged more than 35 project management templates, tools, and checklists into one zip file.
- You un-zip it, and you get all items in formats you can edit to your requirements.
- They strictly contain only standard functionality and no macros or other code.
- You are allowed to use your logo.
or click here for more info.
Traditional PM
Learning Path Navigation
|
|
|
Return to Project Planning Continued
Return from Project Controlling Tools to Home
|
|
|



Your Comments
Have your say about what you just read! Leave me a comment in the box below.